Online Payments
https://pay.paygov.us/enduser/eznet.aspx?ttid=20479
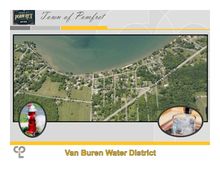
The Town of Pomfret can accept water/sewer payments online. The fee to process online is 3% of the total bill.
Visit the site above, you will need your account number and last name on the account.
The Town of Pomfret can accept water/sewer payments online. The fee to process online is 3% of the total bill.
Visit the site above, you will need your account number and last name on the account.